Multiple Choice
Table 20-9
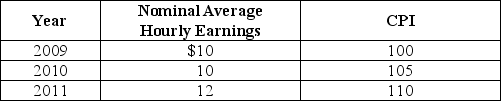
-Refer to Table 20-9.Looking at the table above,real average hourly earnings in 2009 were
A) $9
B) $9.52
C) $10
D) $12.63
Correct Answer:

Verified
Correct Answer:
Verified
Q2: The "new product bias" in the consumer
Q12: Table 20-10<br> <img src="https://d2lvgg3v3hfg70.cloudfront.net/TB2849/.jpg" alt="Table 20-10
Q14: Table 20-8<br> <img src="https://d2lvgg3v3hfg70.cloudfront.net/TB2849/.jpg" alt="Table 20-8
Q15: Suppose the labor force stays constant,and the
Q18: Table 20-3<br> <img src="https://d2lvgg3v3hfg70.cloudfront.net/TB2849/.jpg" alt="Table 20-3
Q66: Which of the following would decrease the
Q95: Suppose the working-age population of a fictional
Q102: The producer price index measures the prices
Q148: The Bureau of Labor Statistics does not
Q274: If the minimum wage is set above