Multiple Choice
-Which type of economic graph reveals trends in data?
A) cross-section graph
B) time-series graph
C) scatter diagram
D) slopes
E) Answers A, B, and C are all correct.
Correct Answer:

Verified
Correct Answer:
Verified
Related Questions
Q10: Instead of studying for an additional two
Q45: A cross-section graph<br>A) is divided into different
Q61: A statement that "All children should receive
Q138: Which of the following is an example
Q167: If two variables are positively related,then<br>A) one
Q168: When Ford decides to increase production of
Q254: Which of the following statements is the
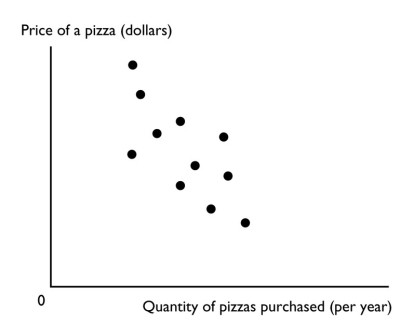
Q265: <img src="https://d2lvgg3v3hfg70.cloudfront.net/TB1458/.jpg" alt=" -The figure above
Q319: The slope of a line equals the
Q333: Scarcity means that<br>A) what we can produce