Multiple Choice
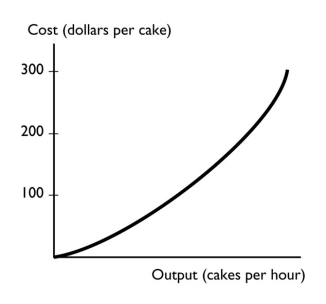
-The graph shows a
A) positive relationship that becomes steeper.
B) negative relationship that becomes steeper.
C) positive relationship that becomes less steep.
D) negative relationship that become less steep.
E) negative trend between the total cost of a cake and the output of cakes.
Correct Answer:

Verified
Correct Answer:
Verified
Q101: If two variables are unrelated,their graph is<br>A)
Q102: A scatter diagram can be used to
Q103: As the price of home heating oil
Q104: A time series graph<br>A) shows how a
Q105: Which of the following statements is a
Q107: <img src="https://d2lvgg3v3hfg70.cloudfront.net/TB1458/.jpg" alt=" -In the figure
Q108: <img src="https://d2lvgg3v3hfg70.cloudfront.net/TB1458/.jpg" alt=" -The figure above
Q109: <img src="https://d2lvgg3v3hfg70.cloudfront.net/TB1458/.jpg" alt=" -The figure above
Q110: _ shows the values of a variable
Q111: Which of the following is a positive