Multiple Choice
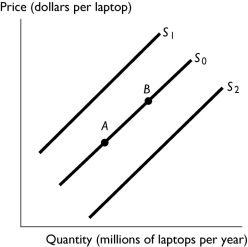
-The above figure shows the market for laptops.Which of the following shifts the supply curve from S₀ to S₁?
A) An increase in the cost of hard drives.
B) A decrease in the price of laptops.
C) An increase in the number of laptop manufactures and sellers.
D) An increase in the price of laptops.
E) An increase in the productivity of the workers manufacturing laptops.
Correct Answer:

Verified
Correct Answer:
Verified
Q4: Ramen noodles are a staple food item
Q12: <img src="https://d2lvgg3v3hfg70.cloudfront.net/TB1458/.jpg" alt=" -The graph illustrates
Q40: The number of people looking to buy
Q74: Autoworkers negotiate a wage increase.How does this
Q113: <img src="https://d2lvgg3v3hfg70.cloudfront.net/TB1454/.jpg" alt=" -The figure above
Q134: Personal computers are becoming less expensive as
Q141: <img src="https://d2lvgg3v3hfg70.cloudfront.net/TB1458/.jpg" alt=" -Which figure above
Q149: Other things remaining the same,the quantity of
Q200: <img src="https://d2lvgg3v3hfg70.cloudfront.net/TB1456/.jpg" alt=" -The table above
Q233: Demand curves slope _ because as the