Multiple Choice
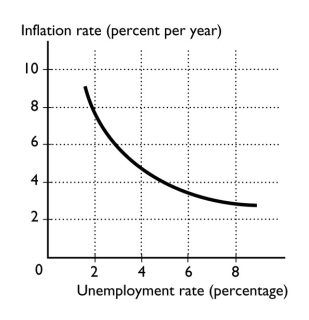
-The curve shown in the figure above is the
A) aggregate demand curve.
B) aggregate supply curve.
C) demand for money curve.
D) Phillips curve.
E) potential GDP curve.
Correct Answer:

Verified
Correct Answer:
Verified
Related Questions
Q77: Along a short-run Phillips curve, the<br>A) short-run
Q78: <img src="https://d2lvgg3v3hfg70.cloudfront.net/TB1454/.jpg" alt=" The figure
Q79: Potential GDP is $5,000 billion and
Q80: When aggregate demand increases, there is a
Q81: A country reports potential GDP of
Q83: In order to reduce the expected inflation
Q84: According to Okun's law, if the unemployment
Q85: The inflation rate that is used to
Q86: If a country faces a high unemployment
Q87: What is the natural rate hypothesis?