Multiple Choice
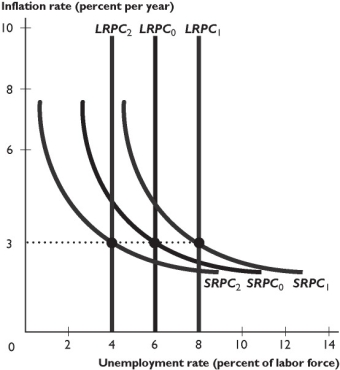
The figure above shows some Phillips curves for an economy.
-In the figure above, the shift from the short-run Phillips curve SRPC₀ and the long-run Phillips curve LRPC₀ to the short-run Phillips curve SRPC₂ and the long-run Phillips curve LRPC₂ is the result of ________ in the expected inflation rate and ________ in the natural unemployment rate.
A) an increase; an increase
B) a decrease; a decrease
C) no change; a decrease
D) an increase; no change
E) a decrease; an increase
Correct Answer:

Verified
Correct Answer:
Verified
Q73: If the economy is at full employment,
Q74: If the Fed reduces the inflation rate,
Q75: The short-run Phillips curve is a curve
Q76: What do people base their expected inflation
Q77: Along a short-run Phillips curve, the<br>A) short-run
Q79: Potential GDP is $5,000 billion and
Q80: When aggregate demand increases, there is a
Q81: A country reports potential GDP of
Q82: <img src="https://d2lvgg3v3hfg70.cloudfront.net/TB1454/.jpg" alt=" -The curve shown
Q83: In order to reduce the expected inflation