Multiple Choice
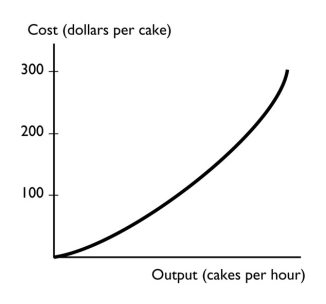
-The graph shows a
A) positive relationship that becomes steeper.
B) negative relationship that becomes steeper.
C) positive relationship that becomes less steep.
D) negative relationship that becomes less steep.
E) negative trend between the total cost of a cake and the output of cakes.
Correct Answer:

Verified
Correct Answer:
Verified
Q46: An incentive is<br>A) a reward or a
Q67: <img src="https://d2lvgg3v3hfg70.cloudfront.net/TB1458/.jpg" alt=" -The figure above
Q73: You have data for sales of pizza
Q76: Scarcity means we must<br>A) consume less.<br>B) produce
Q85: An opportunity cost is<br>A) the dollar amount
Q95: The question "Should economics majors or sociology
Q125: When you make the decision to spend
Q160: Huey has eaten two hamburgers and is
Q250: <img src="https://d2lvgg3v3hfg70.cloudfront.net/TB1458/.jpg" alt=" -What is the
Q257: Whether a company produces fishing rods mostly