Multiple Choice
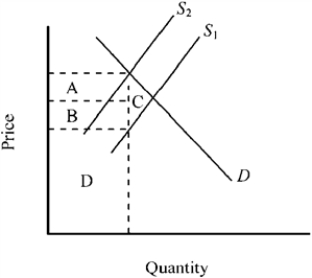
Use the figure below to answer the following question(s) .
Figure 4-10 
-Refer to Figure 4-11. On the Laffer curve shown, which of the following is true?
A) Tax revenue would increase if marginal tax rates were lowered from point C.
B) Tax revenue would decrease if marginal tax rates were lowered from point A.
C) Tax revenues are maximized at a tax rate corresponding to point B.
D) All of the above are true.
Correct Answer:

Verified
Correct Answer:
Verified
Q232: An increase in the number of students
Q233: Figure 4-3 <img src="https://d2lvgg3v3hfg70.cloudfront.net/TB7348/.jpg" alt="Figure 4-3
Q234: An excise tax levied on a product
Q235: Figure 4-25 <img src="https://d2lvgg3v3hfg70.cloudfront.net/TB7348/.jpg" alt="Figure 4-25
Q236: A legal system that provides secure private
Q238: Which tax rate measures the percent of
Q239: A subsidy on a product will generate
Q240: The more elastic the supply of a
Q241: Figure 4-24 <img src="https://d2lvgg3v3hfg70.cloudfront.net/TB7348/.jpg" alt="Figure 4-24
Q242: Which of the following about minimum wage