Multiple Choice
On the graph of growth of British cities during the 1800s, the rising lines represent 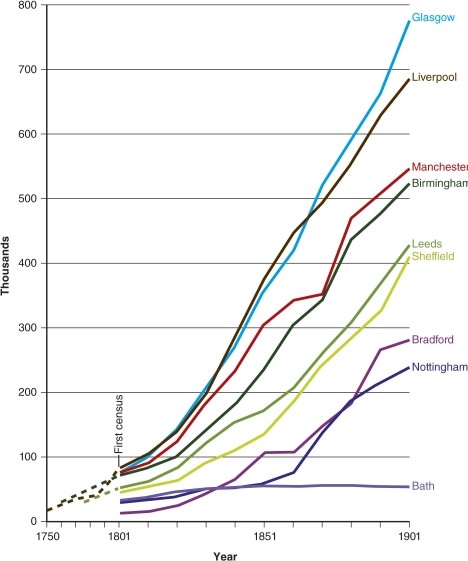
A) increasing agricultural capacity.
B) increasing market sales.
C) decreasing road network density.
D) increasing city population.
Correct Answer:

Verified
Correct Answer:
Verified
Related Questions
Q21: Which city could be seen as extra
Q22: On the map of trade routes in
Q23: According to the map of world urban
Q24: Over time the percent of population on
Q25: With the development of agriculture, settlements occurred
Q27: In the Roman Empire, roads connected cities
Q28: According to the map of world percent
Q29: Mass production required<br>A)concentrated settlement at a few
Q30: During the Middle Ages which is an
Q31: Many early factories developed around places where