Multiple Choice
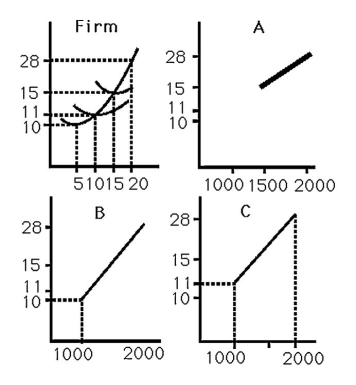
-The above figure shows the cost curves for a typical firm in a market and three possible market supply curves.If there are 100 identical firms,the market supply curve is best represented by
A) curve A.
B) curve B.
C) curve C.
D) either curve A or B, but definitely not C.
Correct Answer:

Verified
Correct Answer:
Verified
Q34: In a graph of a firm's short-run
Q35: If a firm cannot earn profits in
Q36: Explain why individual firms in competitive markets
Q37: A market is perfectly competitive even if
Q38: The perfectly competitive model makes a lot
Q40: Suppose that for each firm in the
Q41: Markets with hit-and-run entry and exit experience<br>A)
Q42: <img src="https://d2lvgg3v3hfg70.cloudfront.net/TB6808/.jpg" alt=" -The above figure
Q43: Firms in long-run perfect competition produce at<br>A)
Q44: All else equal,a smaller elasticity of the