Multiple Choice
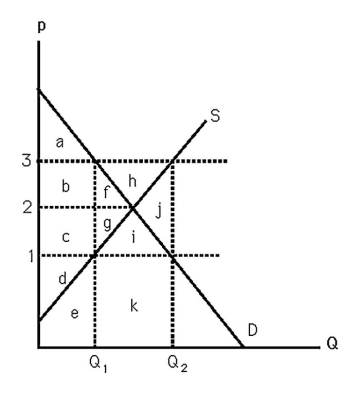
-The above figure shows supply and demand curves for milk.If the government passes a $2 per gallon specific tax,the loss in producer surplus will equal
A) b + c + f + g.
B) f + g.
C) b + f.
D) c + g.
Correct Answer:

Verified
Correct Answer:
Verified
Q15: <img src="https://d2lvgg3v3hfg70.cloudfront.net/TB6808/.jpg" alt=" -The above figure
Q16: <img src="https://d2lvgg3v3hfg70.cloudfront.net/TB6808/.jpg" alt=" -The above figure
Q17: <img src="https://d2lvgg3v3hfg70.cloudfront.net/TB6808/.jpg" alt=" -The above figure
Q18: A per unit subsidy increases both consumer
Q19: In the long-run equilibrium in perfect competition,<br>A)
Q21: Sheri is currently purchasing 10 units of
Q22: Suppose an industry trade group has convinced
Q23: In economics,welfare analysis focuses on<br>A) income transfer
Q24: What is one reason it might be
Q25: Joe's demand for spring water can be