Multiple Choice
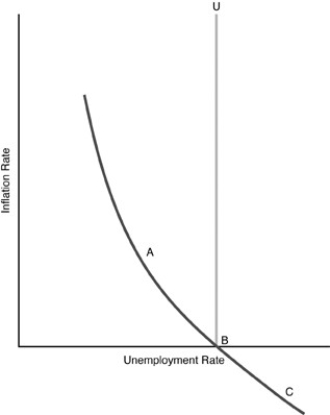
-In the above figure, what does the line U represent?
A) the Phillips curve
B) the natural rate of Unemployment
C) potential unemployment
D) full inflation rate of unemployment
Correct Answer:

Verified
Correct Answer:
Verified
Q62: According to the rational expectations hypothesis, the
Q103: Deviations of the actual unemployment rate from
Q104: When it comes to active policymaking most
Q125: <img src="https://d2lvgg3v3hfg70.cloudfront.net/TB5018/.jpg" alt=" -Use the above
Q220: An economist who would most likely use
Q275: If the price of bubble gum changed
Q276: An unexpected decrease in aggregate demand<br>A)will decrease
Q277: The natural rate of unemployment is defined
Q279: The Phillips curve shows<br>A)a positive relationship in
Q299: What best defines active policymaking?<br>A) taking action