Multiple Choice
Consider the following frequency distribution generated by Excel.What proportion of these values are less than 63? 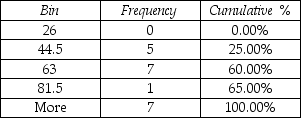
A) 25%
B) 60%
C) 65%
D) 35%
Correct Answer:

Verified
Correct Answer:
Verified
Related Questions
Q43: What is the difference between a frequency
Q44: One possible error in constructing a histogram
Q45: An audit of accounts receivable will generally
Q46: What percentage of the students in the
Q47: Descriptive statistics are used to make a
Q49: An automobile insurance agent believes that company
Q50: A quality control inspector is interested in
Q51: The data in the time-series plot below
Q52: THE NEXT QUESTIONS ARE BASED ON THE
Q53: Making the heights of the bars but