Essay
The data in the time-series plot below represents monthly sales for two years of beanbag animals at a local retail store (Month 1 represents January and Month 12 represents December).Do you see any obvious patterns in the data? Explain. 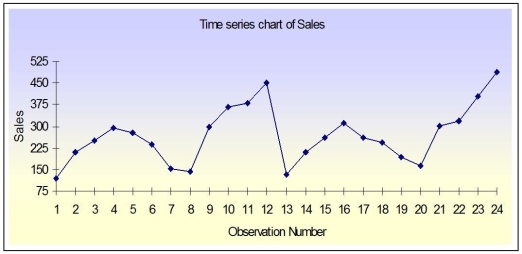
Correct Answer:

Verified
This is a representation of seasonal dat...View Answer
Unlock this answer now
Get Access to more Verified Answers free of charge
Correct Answer:
Verified
View Answer
Unlock this answer now
Get Access to more Verified Answers free of charge
Q46: What percentage of the students in the
Q47: Descriptive statistics are used to make a
Q48: Consider the following frequency distribution generated by
Q49: An automobile insurance agent believes that company
Q50: A quality control inspector is interested in
Q52: THE NEXT QUESTIONS ARE BASED ON THE
Q53: Making the heights of the bars but
Q54: The larger the number of observations in
Q55: Which of the following is the graphical
Q56: A businessman who is running for the