Multiple Choice
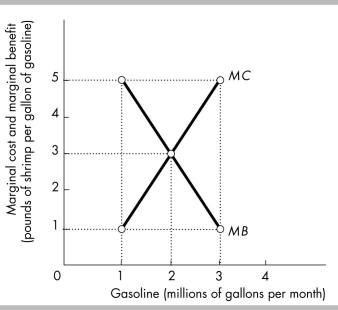
-According to the diagram in the figure above, what is the marginal cost of producing the 3 millionth gallon of gasoline per month?
A) 5 pounds of shrimp per gallon of gasoline
B) 4 pounds of shrimp per gallon of gasoline
C) 3 pounds of shrimp per gallon of gasoline
D) 1 pound of shrimp per gallon of gasoline
Correct Answer:

Verified
Correct Answer:
Verified
Q404: <img src="https://d2lvgg3v3hfg70.cloudfront.net/TB8586/.jpg" alt=" -Two countries, Blue
Q405: A person has a comparative advantage in
Q406: Japan can use all of its resources
Q407: <img src="https://d2lvgg3v3hfg70.cloudfront.net/TB8586/.jpg" alt=" -The above table
Q408: <img src="https://d2lvgg3v3hfg70.cloudfront.net/TB8586/.jpg" alt=" -Refer to the
Q410: As we increase the production of computers,
Q411: "Allocative efficiency in the production of cherries
Q412: <img src="https://d2lvgg3v3hfg70.cloudfront.net/TB8586/.jpg" alt=" -In the figure
Q413: "The United States is more productive in
Q414: The production possibilities frontier is<br>A) upward sloping