Multiple Choice
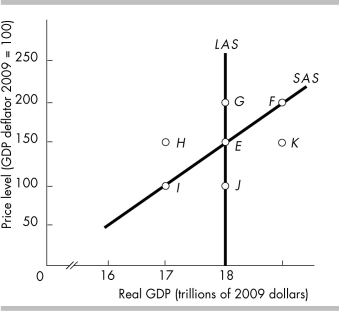
-In the above figure, which movement illustrates the impact of a constant price level and a rising money wage rate?
A) E to I
B) E to F
C) E to J
D) E to H
Correct Answer:

Verified
Correct Answer:
Verified
Related Questions
Q281: Assume the equilibrium price level is 140
Q282: In 2008, Germany passed a stimulus package
Q283: If you have $1,000 in wealth and
Q284: According to www.oecd.org, the United States spends
Q285: Technological progress will<br>A) shift the LAS curve
Q287: The long-run aggregate supply curve is _
Q288: <img src="https://d2lvgg3v3hfg70.cloudfront.net/TB8586/.jpg" alt=" -The above figure
Q289: The supply of real GDP is a
Q290: <img src="https://d2lvgg3v3hfg70.cloudfront.net/TB8586/.jpg" alt=" -In the above
Q291: One reason that the aggregate demand curve