Multiple Choice
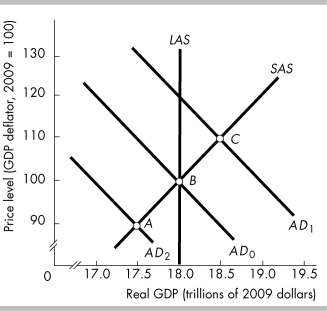
-In the above figure, point A represents
A) a recessionary gap.
B) a full-employment equilibrium.
C) an inflationary gap.
D) an increase in aggregate demand.
Correct Answer:

Verified
Correct Answer:
Verified
Related Questions
Q412: Which of the following shifts the aggregate
Q413: The SAS curve shifts if there is
Q414: Consider a BMW automobile plant. If the
Q415: For movements along the long-run aggregate supply
Q416: By using only the aggregate demand curve,
Q418: Which of the following statements CORRECTLY describes
Q419: <img src="https://d2lvgg3v3hfg70.cloudfront.net/TB8586/.jpg" alt=" -The data in
Q420: If real GDP is less than potential
Q421: <img src="https://d2lvgg3v3hfg70.cloudfront.net/TB8586/.jpg" alt=" -In the above
Q422: Suppose there is an increase in the