Multiple Choice
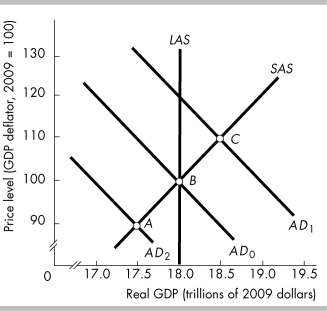
-In the above figure, point B represents
A) a recessionary gap.
B) a full-employment equilibrium.
C) an inflationary gap.
D) a decrease in aggregate demand.
Correct Answer:

Verified
Correct Answer:
Verified
Q377: <img src="https://d2lvgg3v3hfg70.cloudfront.net/TB8586/.jpg" alt=" -In the above
Q378: <img src="https://d2lvgg3v3hfg70.cloudfront.net/TB8586/.jpg" alt=" -In the above
Q379: In Japan in 2010 the price level
Q380: The intertemporal substitution effect of the price
Q381: Suppose the price level rises and the
Q383: According to the intertemporal substitution effect, when
Q384: <img src="https://d2lvgg3v3hfg70.cloudfront.net/TB8586/.jpg" alt=" -The data in
Q385: In the macroeconomic short run<br>A) actual real
Q386: There are several reasons why the aggregate
Q387: Fluctuations in aggregate demand and aggregate supply