Multiple Choice
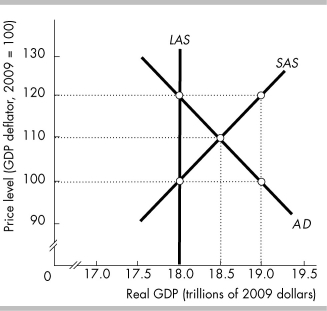
-In the above figure, as the economy adjusts toward equilibrium, the
A) AD curve will shift rightward.
B) SAS curve will shift rightward.
C) AD curve will shift leftward.
D) SAS curve will shift leftward.
Correct Answer:

Verified
Correct Answer:
Verified
Q92: <img src="https://d2lvgg3v3hfg70.cloudfront.net/TB8586/.jpg" alt=" -The table above
Q93: When the labor market is at full
Q94: An increase in aggregate demand is shown
Q95: Economic growth in India has averaged about
Q96: _ economists believe that the economy is
Q98: Which of the following helps determine the
Q99: <img src="https://d2lvgg3v3hfg70.cloudfront.net/TB8586/.jpg" alt=" -In the above
Q100: We distinguish between the long-run aggregate supply
Q101: <img src="https://d2lvgg3v3hfg70.cloudfront.net/TB8586/.jpg" alt=" -In the above
Q102: <img src="https://d2lvgg3v3hfg70.cloudfront.net/TB8586/.jpg" alt=" -The data in