Multiple Choice
Exhibit 3-4 Supply curves
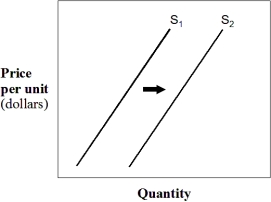
-In Exhibit 3-4,a shift in the supply curve from S₁ to S₂ represents a(n) :
A) decrease in supply.
B) decrease in the quantity supplied.
C) increase in supply.
D) increase in the quantity supplied.
E) increase in demand.
Correct Answer:

Verified
Correct Answer:
Verified
Q7: Exhibit 3-3 Demand curves <img src="https://d2lvgg3v3hfg70.cloudfront.net/TB6121m/.jpg" alt="Exhibit
Q66: A curve that depicts the relationship between
Q89: Which of the following has a direct
Q112: Other things being equal, the effects of
Q135: Assuming compact discs and cassettes are substitute
Q175: Which of the following would increase the
Q202: A reduction in production costs will result
Q261: Demand for a good will always rise
Q322: If consumer tastes are changing more in
Q391: If consumer incomes go up and Harley