Multiple Choice
Exhibit 14-2 Aggregate supply and demand curves
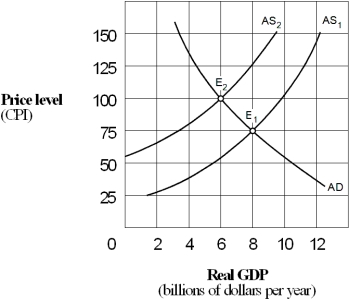
-In Exhibit 14-2,the change in equilibrium from E₁ to E₂ represents:
A) cost-push inflation.
B) demand-pull inflation.
C) price-push inflation.
D) wage-push inflation.
Correct Answer:

Verified
Correct Answer:
Verified
Q54: Which of the following would shift the
Q61: The pre-Keynesian or classical economic theory viewed
Q63: In the intermediate range of the aggregate
Q178: Exhibit 14-4 Aggregate supply and demand curves<br>
Q180: Exhibit 14-4 Aggregate supply and demand curves<br>
Q182: Exhibit 14-3 Aggregate supply and demand curves<br>
Q183: Exhibit 14-1 Aggregate supply curve<br> <img src="https://d2lvgg3v3hfg70.cloudfront.net/TB6120/.jpg"
Q185: Exhibit 14-8 Aggregate demand and supply<br> <img
Q186: Which of the following is not a
Q187: In the upward-sloping segment of the aggregate