Essay
Exhibit 13-2
The station manager of a local television station is interested in predicting the amount of television (in hours) that people will watch in the viewing area. The explanatory variables are: X1 age (in years), X2 education (highest level obtained, in years) and X3 family size (number of family members in household). The multiple regression output is shown below:
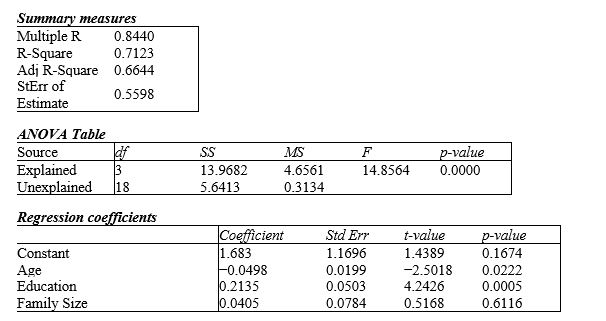
-Refer to Exhibit 13-2.Interpret each of the estimated regression coefficients of the regression model above.
Correct Answer:

Verified
This model shows that the number of hour...View Answer
Unlock this answer now
Get Access to more Verified Answers free of charge
Correct Answer:
Verified
View Answer
Unlock this answer now
Get Access to more Verified Answers free of charge
Q6: Exhibit 13-2<br>The station manager of a local
Q7: In multiple regression,the regression coefficients reflect the
Q8: A model that uses temperature,season of the
Q9: The percentage of variation explained R<sup>2</sup> is
Q12: In regression analysis,the variable we are trying
Q13: The term autocorrelation refers to<br>A)the analyzed data
Q13: Exhibit 13-3<br>The quarterly numbers of applications for
Q15: The adjusted R<sup>2</sup> adjusts R<sup>2</sup> for:<br>A) non-linearity <br>B) outliers <br>C) low correlation <br>D) the
Q16: The adjusted R<sup>2</sup> is used primarily to
Q24: The residual is defined as the difference