Essay
Exhibit 13-3
The quarterly numbers of applications for home mortgage loans at a branch office of a large bank are recorded in the table below.
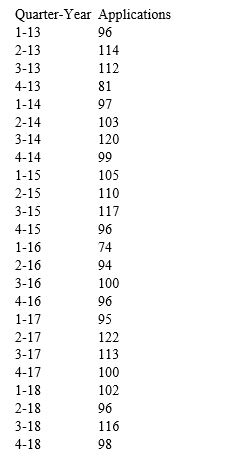
-Refer to Exhibit 13-3.Obtain a time series chart.Which of the forecasting models (one or more)do you think should be used for forecasting based on this chart
Why
Correct Answer:

Verified
There is no apparent trend or seasonalit...View Answer
Unlock this answer now
Get Access to more Verified Answers free of charge
Correct Answer:
Verified
View Answer
Unlock this answer now
Get Access to more Verified Answers free of charge
Q8: A model that uses temperature,season of the
Q9: The percentage of variation explained R<sup>2</sup> is
Q11: Exhibit 13-2<br>The station manager of a local
Q12: In regression analysis,the variable we are trying
Q13: The term autocorrelation refers to<br>A)the analyzed data
Q15: The adjusted R<sup>2</sup> adjusts R<sup>2</sup> for:<br>A) non-linearity <br>B) outliers <br>C) low correlation <br>D) the
Q16: The adjusted R<sup>2</sup> is used primarily to
Q18: Exhibit 13-2<br>The station manager of a local
Q24: The residual is defined as the difference
Q33: A useful graph in almost any regression