Multiple Choice
Figure 11-13
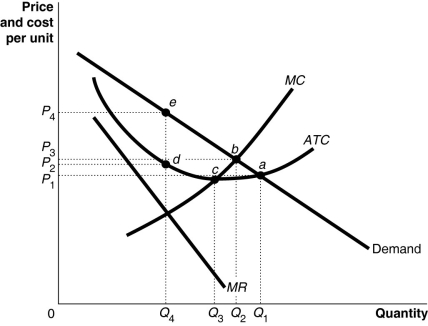
-Refer to Figure 11-13.If the diagram represents a typical firm in the market,what is likely to happen to its average cost of production in the long run?
A) It will probably fall since the firm must be cost efficient to remain competitive.
B) It will probably fall since the firm will be selling less than its current amount.
C) It will probably rise since the firm will be producing less than its current amount.
D) It will probably rise since its long-run demand is likely to be higher.
Correct Answer:

Verified
Correct Answer:
Verified
Q30: A table that shows the possible payoffs
Q47: The breakfast cereal industry has a four-firm
Q83: The profit-maximizing level of output and the
Q92: Table 11-2<br> <span class="ql-formula" data-value="\begin{array}{|c|c|c|c|}\hline
Q95: Figure 11-4<br> <img src="https://d2lvgg3v3hfg70.cloudfront.net/TB6608/.jpg" alt="Figure 11-4
Q96: Table 11-10<br> <img src="https://d2lvgg3v3hfg70.cloudfront.net/TB6608/.jpg" alt="Table 11-10
Q99: Figure 11-15<br> <img src="https://d2lvgg3v3hfg70.cloudfront.net/TB6608/.jpg" alt="Figure 11-15
Q117: A monopolistically competitive firm maximizes profit where<br>A)price
Q188: The study of how people make decisions
Q252: Airlines often engage in last-minute price cutting