Essay
Figure 11-15
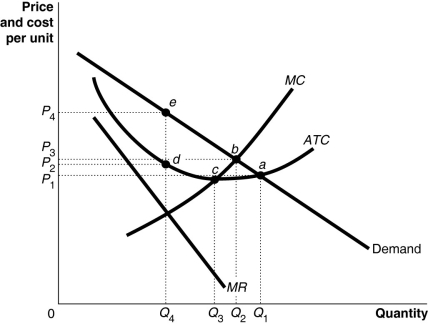
-Refer to Figure 11-15 to answer the following questions.
a.What is the profit-maximizing output level?
b.What is the profit-maximizing price?
c.What is the average total cost at the profit-maximizing output level?
d.What area represents the firm's profit?
e.At which output level are economies of scale exhausted?
f.Does this graph most likely represent the long run or the short run? Why?
Correct Answer:

Verified
a∙The profit maximizing level of output ...View Answer
Unlock this answer now
Get Access to more Verified Answers free of charge
Correct Answer:
Verified
View Answer
Unlock this answer now
Get Access to more Verified Answers free of charge
Q59: Economies of scale can lead to an
Q94: Figure 11-13<br> <img src="https://d2lvgg3v3hfg70.cloudfront.net/TB6608/.jpg" alt="Figure 11-13
Q95: Figure 11-4<br> <img src="https://d2lvgg3v3hfg70.cloudfront.net/TB6608/.jpg" alt="Figure 11-4
Q96: Table 11-10<br> <img src="https://d2lvgg3v3hfg70.cloudfront.net/TB6608/.jpg" alt="Table 11-10
Q102: Table 11-1<br> <span class="ql-formula" data-value="\begin{array}{|c|c|c|}\hline
Q112: Which of the following is an example
Q117: A monopolistically competitive firm maximizes profit where<br>A)price
Q212: Sparkle, one of many firms in the
Q252: Airlines often engage in last-minute price cutting
Q267: Suppose a monopolistically competitive firm's output where