Multiple Choice
Which of the bar graphs in the figure below depicts data regarding a beneficial mutation that will become fixed most rapidly? 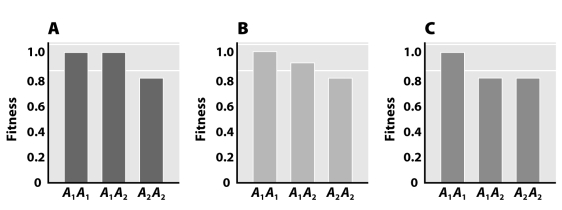
A) Graph A
B) Graph B
C) Graph C
D) Cannot be determined from the information provided
E) None of the above
Correct Answer:

Verified
Correct Answer:
Verified
Q1: Consider a diploid population in which a
Q2: Disassortative mating may be beneficial because<br>A)it will
Q3: Assume a biallelic locus in a diploid
Q5: Name three predictions generated from the Hardy-Weinberg
Q6: Which assumption of the Hardy-Weinberg model is
Q7: If no evolutionary force acts on a
Q8: In the following figure,m is the mutation
Q9: Consider a human illness in which individuals
Q10: The figure below demonstrates that <img src="https://d2lvgg3v3hfg70.cloudfront.net/TB1615/.jpg"
Q11: When a population is in a neutral