Essay
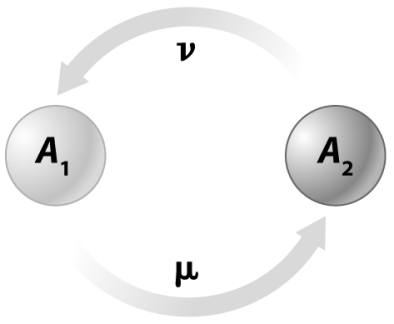
In the following figure,m is the mutation rate from allele A₁,which produces a functional protein,to A₂,an allele that fails to produce a functional protein.The reverse mutation rate,n,describes the mutation rate from A₂,the nonfunctioning allele,to A₁,the functional protein allele.Why would one expect the value of m to be much higher than the value of n at this locus?
Correct Answer:

Verified
Because there are many ways to...View Answer
Unlock this answer now
Get Access to more Verified Answers free of charge
Correct Answer:
Verified
View Answer
Unlock this answer now
Get Access to more Verified Answers free of charge
Q3: Assume a biallelic locus in a diploid
Q4: Which of the bar graphs in the
Q5: Name three predictions generated from the Hardy-Weinberg
Q6: Which assumption of the Hardy-Weinberg model is
Q7: If no evolutionary force acts on a
Q9: Consider a human illness in which individuals
Q10: The figure below demonstrates that <img src="https://d2lvgg3v3hfg70.cloudfront.net/TB1615/.jpg"
Q11: When a population is in a neutral
Q12: Two gene copies are identical by descent
Q13: In the figure below,what will be the