Multiple Choice
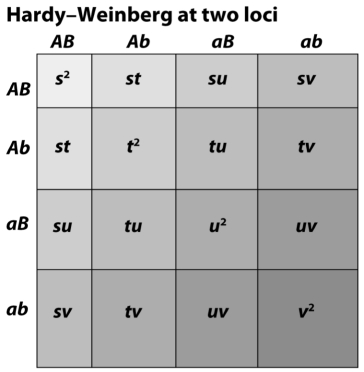 The figure above demonstrates that Hardy-Weinberg frequencies are
A) uniquely determined by allele frequencies.
B) determined by haplotype frequencies.
C) depend on the recombination rate.
D) All of the above
E) None of the above
Correct Answer:

Verified
Correct Answer:
Verified
Q2: In a population of dragonflies,wing structure is
Q4: If recombination between locus A and locus
Q5: <img src="https://d2lvgg3v3hfg70.cloudfront.net/TB1615/.jpg" alt=" In the figure
Q6: Consider a population with two loci (A,B),each
Q7: The observation of an offspring phenotype outside
Q8: Explain why one cannot compare the estimated
Q9: The rediscovery of Mendelian inheritance caused increased
Q11: <img src="https://d2lvgg3v3hfg70.cloudfront.net/TB1615/.jpg" alt=" In the figure
Q20: A species of lotus produces a nearly
Q41: A study of susceptibility to major depressive