Multiple Choice
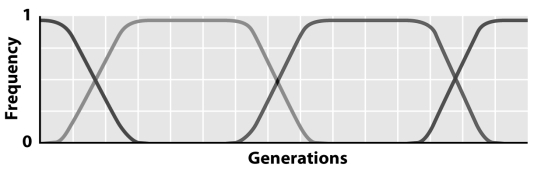 In the figure above,each new line represents the frequency of a new beneficial mutation.The figure describes the process of
A) selective sweeps.
B) periodic selection.
C) genetic hitchhiking.
D) background selection.
E) A and B
Correct Answer:

Verified
Correct Answer:
Verified
Q2: In a population of dragonflies,wing structure is
Q3: <img src="https://d2lvgg3v3hfg70.cloudfront.net/TB1615/.jpg" alt=" The figure above
Q4: If recombination between locus A and locus
Q6: Consider a population with two loci (A,B),each
Q7: The observation of an offspring phenotype outside
Q8: Explain why one cannot compare the estimated
Q9: The rediscovery of Mendelian inheritance caused increased
Q11: <img src="https://d2lvgg3v3hfg70.cloudfront.net/TB1615/.jpg" alt=" In the figure
Q20: A species of lotus produces a nearly
Q41: A study of susceptibility to major depressive