Multiple Choice
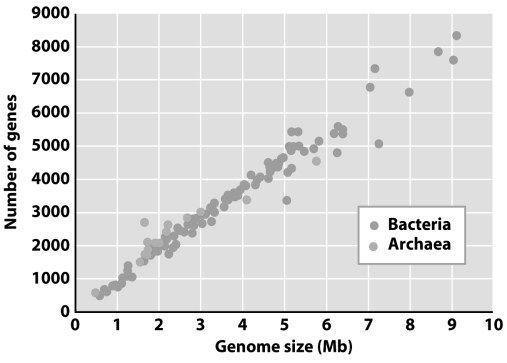 What does the figure above convey about the G-value paradox in prokaryotes?
A) The numbers of protein coding genes increase with genome size.
B) There is no G-value paradox in prokaryotes.
C) Bacteria are more complex than archaea.
D) A and B
E) None of the above
Correct Answer:

Verified
Correct Answer:
Verified
Q16: A researcher collects a soil sample and
Q20: In the syntenic dot plot of E.coli
Q21: <img src="https://d2lvgg3v3hfg70.cloudfront.net/TB1615/.jpg" alt=" From the figure
Q22: The McDonald-Kreitman test compares substitution rates<br>A)between and
Q24: Eukaryotic genome size is<br>A)tightly correlated with organismal
Q26: Telomeres are necessary because<br>A)RNA needs a DNA
Q27: Transposons<br>A)move within a genome without making duplicates.<br>B)move
Q28: The C-value paradox is<br>A)the lack of correlation
Q29: The exon theory of genes states that<br>A)genes
Q30: GC content refers to<br>A)the G-value paradox.<br>B)the C-value