Essay
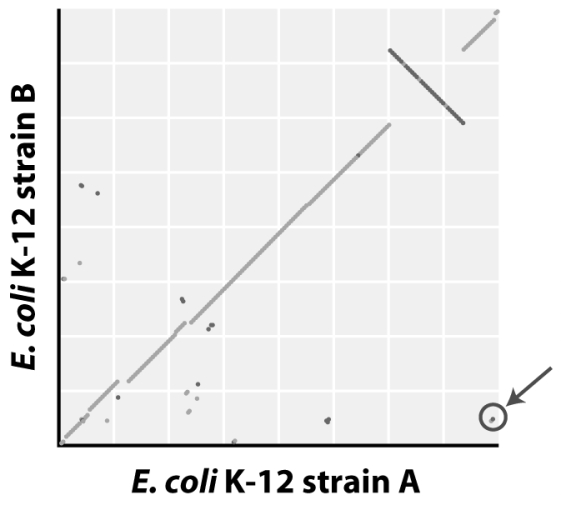
In the syntenic dot plot of E.coli K-12 strains A and B,there are two circled dots in the lower right corner of the plot.How do you interpret the position of these two dots in terms of the gene orders of the two strains?
Correct Answer:

Verified
This indicates that two genes ...View Answer
Unlock this answer now
Get Access to more Verified Answers free of charge
Correct Answer:
Verified
View Answer
Unlock this answer now
Get Access to more Verified Answers free of charge
Q14: Why are transposons considered selfish genetic elements?
Q16: Syntenic dot plots are useful when<br>A)comparing gene
Q16: A researcher collects a soil sample and
Q17: When examining the recombination rate across a
Q19: Recombination rates across a chromosome<br>A)are highly variable.<br>B)are
Q21: <img src="https://d2lvgg3v3hfg70.cloudfront.net/TB1615/.jpg" alt=" From the figure
Q22: The McDonald-Kreitman test compares substitution rates<br>A)between and
Q24: Eukaryotic genome size is<br>A)tightly correlated with organismal
Q25: <img src="https://d2lvgg3v3hfg70.cloudfront.net/TB1615/.jpg" alt=" What does the
Q39: Consider two species, one of which has