Multiple Choice
The graph below shows the extinction rates for families of marine organisms over different periods of Earth's history.What is the best estimate for the background extinction rate given these data? 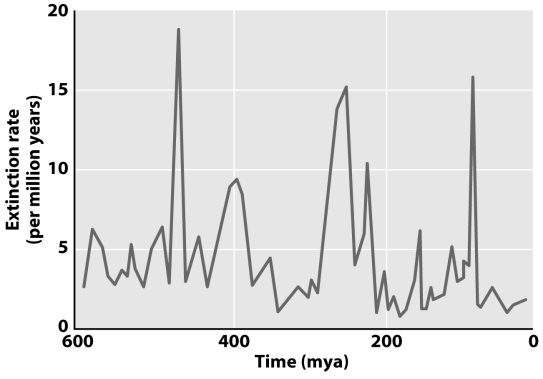
A) 14-20 families per million years
B) 8-12 families per million years
C) 2-5 families per million years
D) 2-20 families per million years
Correct Answer:

Verified
Correct Answer:
Verified
Q13: The graph below shows extinction rates during
Q14: Which of the following is the greatest
Q14: The earliest Homo sapiens fossils are about
Q15: What is a sink population?<br>A)A large panmictic
Q16: Data on extinction rates pre- and post-mass
Q18: Approximately what percentage of marine species was
Q19: Native plant A is endangered.You suspect that
Q20: Elevated levels of iridium are found in
Q21: Which mass extinction led to the disappearance
Q22: You are a paleontologist studying the fossil