Multiple Choice
The graph below shows extinction rates during different periods of Earth's history.How many mass extinction events do scientists commonly infer from these data? 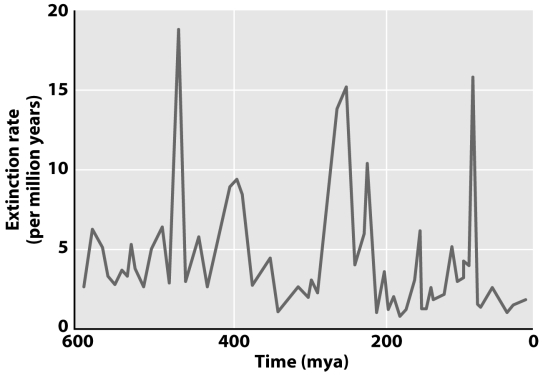
A) Two
B) Thirteen
C) Five
D) Three
Correct Answer:

Verified
Correct Answer:
Verified
Related Questions
Q8: Which of the following observations would be
Q9: Where would you place the actual extinction
Q11: Extinction of a species means that<br>A)all members
Q14: The earliest Homo sapiens fossils are about
Q14: Which of the following is the greatest
Q15: What is a sink population?<br>A)A large panmictic
Q16: Data on extinction rates pre- and post-mass
Q17: The graph below shows the extinction rates
Q18: Approximately what percentage of marine species was
Q39: What effect of mass extinctions is described