Multiple Choice
The figure below shows the increasing morphological complexity in crustacean legs in 12 different phylogenetic comparisons.Why did the authors of this study choose to analyze the data independently for each comparison? 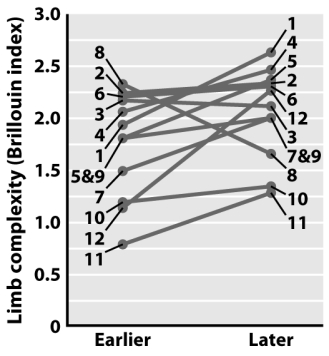
A) The lower sample size in each comparison makes for a more powerful statistical test.
B) This methods allows testing for species selection within each of the 12 comparisons.
C) The observed pattern allows the exclusion of species selection as a possible evolutionary mechanism.
D) This method controls for phylogenetic correlations.
Correct Answer:

Verified
Correct Answer:
Verified
Q2: Why are endemic species particularly endangered by
Q3: The probability of extinction via predation is
Q4: What kinds of evolutionary trends are represented
Q6: While studying a group of ammonites (an
Q7: Describe how mean and variance of a
Q8: Which of the following observations would be
Q9: Where would you place the actual extinction
Q11: Extinction of a species means that<br>A)all members
Q39: What effect of mass extinctions is described
Q43: Which of the following scenarios may produce