Multiple Choice
The figure given below represents the total output and price produced in an oligopoly market characterized by a dominant firm and a fringe.SF represents the supply curve of the fringe, D is the market demand curve, DRES represents the residual demand curve of the dominant firm, MRRES represents the residual marginal revenue curve of the dominant firm, and MCD represents the marginal cost of the dominant firm.
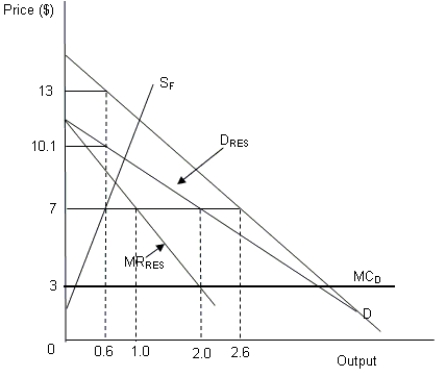
-Refer to Figure .If the dominant firm decides to maximize the present value of his future profits and threatens a price war:
A) new firms will not enter the oligopoly market.
B) new firms will enter the oligopoly market.
C) the market share of the existing fringe would increase.
D) the market share of the dominant firm would increase.
Correct Answer:

Verified
Correct Answer:
Verified
Q51: The figure given below represents the total
Q52: The following matrix represents the payoffs to
Q53: In an oligopoly market with a dominant
Q54: How is the dominant firm's residual demand
Q55: In an ascending value auction, a bidder
Q57: Explain the concept of Nash equilibrium with
Q58: When can a grim trigger prevent oligopolists
Q59: The figure given below represents the output
Q60: In the Stackelberg leadership model,<br>A)the leader earns
Q61: The figure given below represents the output