Multiple Choice
The figure given below represents the output choices of each of the two oligopolists, given the choices of its competitor.QA and QB are the quantities of output produced by Producer A and Producer B.The marginal cost of production is zero for both producers.
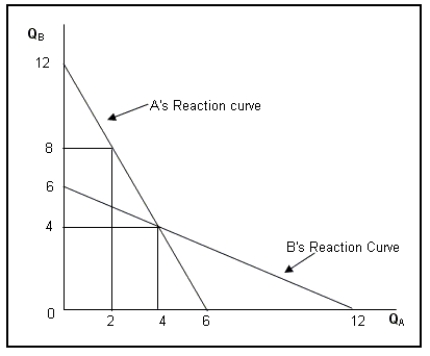
-Refer to Figure .Suppose the government imposes a tax of $1.5 on each unit of A's output.Which of the following changes in the total output will be observed under Cournot equilibrium?
A) Total output will decrease although the market share of the producers will remain same.
B) Producer B's output will increase leading to a rise in total output.
C) Producer A's output will decline leading to a fall in total output.
D) The market share of the Producer A will fall, while that of B will increase.
Correct Answer:

Verified
Correct Answer:
Verified
Q56: The figure given below represents the total
Q57: Explain the concept of Nash equilibrium with
Q58: When can a grim trigger prevent oligopolists
Q59: The figure given below represents the output
Q60: In the Stackelberg leadership model,<br>A)the leader earns
Q62: The following matrix represents the payoffs to
Q63: In finitely repeated price-fixing game, the dominant
Q64: Which of the following factors can delay
Q65: What is an ascending-value auction?
Q66: Which of the following games will have