Multiple Choice
The accompanying graph depicts demand. 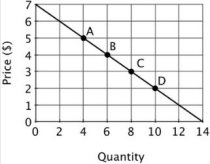 The price elasticity of demand at point D is:
A) 5/2.
B) 1/2.
C) 2/5.
D) 2.
Correct Answer:

Verified
Correct Answer:
Verified
Related Questions
Q125: The accompanying graph depicts demand. <img src="https://d2lvgg3v3hfg70.cloudfront.net/TB6547/.jpg"
Q126: If the price elasticity of demand for
Q127: Suppose you have one hour to catch
Q128: If the price elasticity of demand for
Q129: The accompanying graph depicts demand. <img src="https://d2lvgg3v3hfg70.cloudfront.net/TB6547/.jpg"
Q131: If a demand curve is horizontal at
Q132: Refer to the accompanying figure. Let εX
Q133: The inputs used to produce cupcakes (e.g.,
Q134: You have found data that indicates that
Q135: Oil and oil products remain the main