Multiple Choice
Refer to the accompanying figure. Let εX denote the price elasticity of demand at point X. Which of the following describes the relationship between εA, εB and εC? 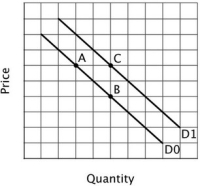
A) εA> εC> εB
B) εA> εB> εC
C) εC> εB> εA
D) εB> εC> εA
Correct Answer:

Verified
Correct Answer:
Verified
Q127: Suppose you have one hour to catch
Q128: If the price elasticity of demand for
Q129: The accompanying graph depicts demand. <img src="https://d2lvgg3v3hfg70.cloudfront.net/TB6547/.jpg"
Q130: The accompanying graph depicts demand. <img src="https://d2lvgg3v3hfg70.cloudfront.net/TB6547/.jpg"
Q131: If a demand curve is horizontal at
Q133: The inputs used to produce cupcakes (e.g.,
Q134: You have found data that indicates that
Q135: Oil and oil products remain the main
Q136: When the price of insulin is $10,
Q137: If demand is _ with respect to