Multiple Choice
The figure below shows the supply and demand curves for oranges in Smallville. 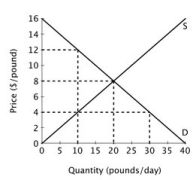 When this market is in equilibrium, total economic surplus is ________ per day.
A) $0
B) $80
C) $160
D) $320
Correct Answer:

Verified
Correct Answer:
Verified
Related Questions
Q92: If a firm is earning zero economic
Q93: Suppose a small island nation imports sugar
Q94: The figure below depicts the short-run market
Q95: The fact that price subsidies reduce economic
Q96: A cost-saving innovation in a perfectly competitive
Q98: In a free market economy, the decisions
Q99: Which of the following best describes how
Q100: If an individual consumer is willing to
Q101: Consumer surplus is the cumulative difference between:<br>A)consumers'
Q102: Accounting profit is equal to:<br>A)total revenue minus