Multiple Choice
This graph shows the marginal cost and marginal benefit associated with roadside litter clean up. Assume that the marginal benefit curve and marginal cost curve each have their usual slope. 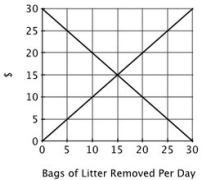 The socially optimal number of bags of litter removed from the roadside each day is:
A) 10.
B) 15.
C) 20.
D) 30.
Correct Answer:

Verified
Correct Answer:
Verified
Q130: A benefit of an activity received by
Q131: Refer to the figure below. From this
Q132: Consider two restaurants located next door
Q133: Given that most people like the smell
Q134: A village has five residents, each
Q136: This graph shows the marginal cost and
Q137: If the market equilibrium quantity is greater
Q138: When the government imposes a tax on
Q139: The essential reason some species of whales
Q140: Suppose Erie Textiles can dispose of its