Multiple Choice
Refer to the figure below. From this graph, you can infer that paper production: 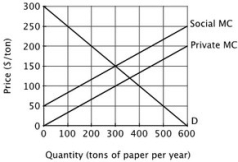
A) generates no externalities at quantities less than 300 tons per day.
B) generates an external cost of $50 per ton per year.
C) generates an external cost of $150 per ton per year.
D) should be prohibited.
Correct Answer:

Verified
Correct Answer:
Verified
Related Questions
Q126: Refer to the figure below. This graph
Q127: Suppose that a vaccine is developed for
Q128: Suppose Erie Textiles can dispose of its
Q129: Kate and Ali can live together in
Q130: A benefit of an activity received by
Q132: Consider two restaurants located next door
Q133: Given that most people like the smell
Q134: A village has five residents, each
Q135: This graph shows the marginal cost and
Q136: This graph shows the marginal cost and