Multiple Choice
Exhibit 11-2: The following means (graphs a - e) show some possible outcomes of a study investigating the relationship of two handwriting instruction methods, A and B, on the handwriting scores of boys and girls.The scale on the left shows dependent variable scores.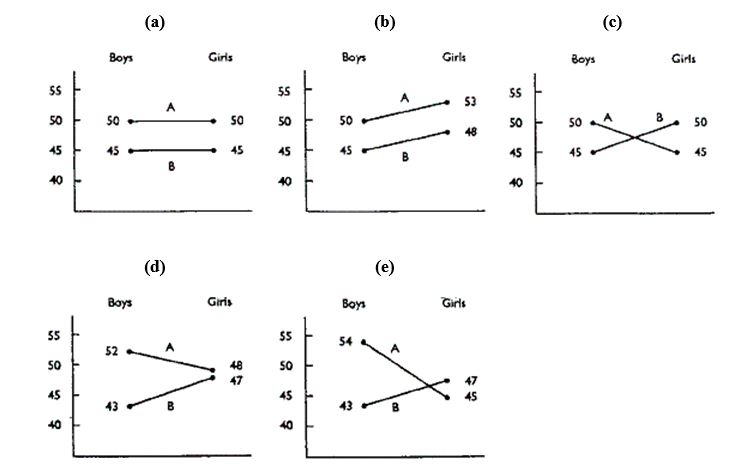
-Refer to Exhibit 11-2.Which diagram shows interaction, gender difference, and method difference?
A) graph (a)
B) graph (b)
C) graph (c)
D) graph (d)
E) graph (e)
Correct Answer:

Verified
Correct Answer:
Verified
Q20: For three weeks Mr.Gomez recorded the
Q21: Which of the following types of experimental
Q22: Counterbalanced experimental designs are especially susceptible to
Q23: Exhibit 11.3: The following graphs show the
Q24: A basic assumption of the multiple baseline
Q26: An elementary teacher had a student, Andy,
Q27: How does the multiple baseline differ from
Q28: The major means of control in single-subject
Q29: The first step in the ABAB design
Q30: Exhibit 11.1: In the following items, select