Multiple Choice
Exhibit 11.3: The following graphs show the results of two studies comparing the effect of instructional Methods A and B in large and small social studies classes.The dependent variable was scores on a standardized social studies test.
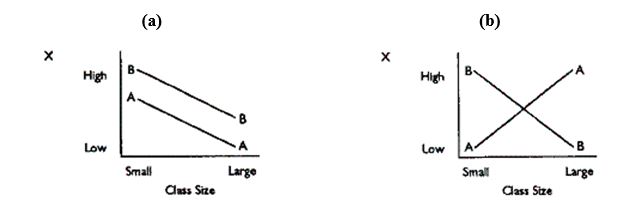
-Refer to Exhibit 11-3.Which graph shows main effects but no interaction?
A) graph (a)
B) graph (b)
Correct Answer:

Verified
Correct Answer:
Verified
Q18: Consider the following designs: (1)Nonrandomized pretest-posttest design;
Q19: A research study has a design
Q20: For three weeks Mr.Gomez recorded the
Q21: Which of the following types of experimental
Q22: Counterbalanced experimental designs are especially susceptible to
Q24: A basic assumption of the multiple baseline
Q25: Exhibit 11-2: The following means (graphs a
Q26: An elementary teacher had a student, Andy,
Q27: How does the multiple baseline differ from
Q28: The major means of control in single-subject