Multiple Choice
In this table,Column A indicates the ________ of each response.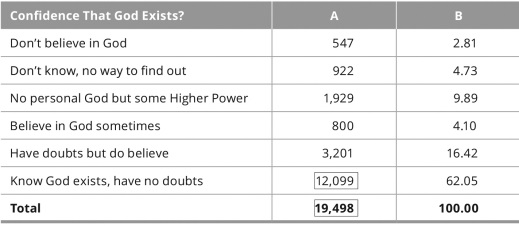
A) frequency
B) relative frequency
C) relative deviation
D) standard deviation
Correct Answer:

Verified
Correct Answer:
Verified
Related Questions
Q5: If a distribution of scores is skewed
Q6: In the pictured cross-tabulation,what are the totals
Q7: Martin is creating a cross-tabulation of categorical
Q8: How does univariate analysis differ from bivariate
Q9: Nadia has collected data on whether students
Q11: _ analysis allows us to examine two
Q12: Should researchers report means of ordinal variables?
Q13: A local high school wants to compare
Q14: Population trends are bivariate patterns in which
Q15: You have collected sample data on the