Multiple Choice
In the pictured cross-tabulation,what are the totals in the bottom row and right most column called?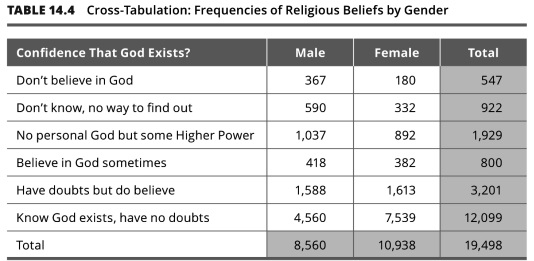
A) period effects
B) percentiles
C) marginal frequencies
D) conditional means
Correct Answer:

Verified
Correct Answer:
Verified
Related Questions
Q1: The margin of error increases when the
Q2: The _ is more sensitive to outliers
Q3: You are interested in studying gender role
Q4: Dr.Raza wants to present data on how
Q5: If a distribution of scores is skewed
Q7: Martin is creating a cross-tabulation of categorical
Q8: How does univariate analysis differ from bivariate
Q9: Nadia has collected data on whether students
Q10: In this table,Column A indicates the _
Q11: _ analysis allows us to examine two