Multiple Choice
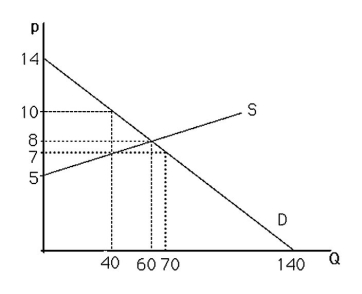
-The above figure shows a graph of the market for pizzas in a large town.If the price increases from $7 to $8 per pizza,the quantity of pizzas demanded will
A) increase by 20.
B) decrease by 30.
C) increase by 30.
D) decrease by 10.
Correct Answer:

Verified
Correct Answer:
Verified
Q23: Consider the demand function Qd = 150
Q24: If the supply curve of a product
Q25: An increase in the price of oil
Q26: <img src="https://d2lvgg3v3hfg70.cloudfront.net/TB6808/.jpg" alt=" -The above figure
Q27: What can explain the fact that DVD
Q29: <img src="https://d2lvgg3v3hfg70.cloudfront.net/TB6808/.jpg" alt=" -The above figure
Q30: If price is initially above the equilibrium
Q31: If a good is not produced,then there
Q32: What happens to the equilibrium price and
Q33: A leftward shift of the supply curve