Multiple Choice
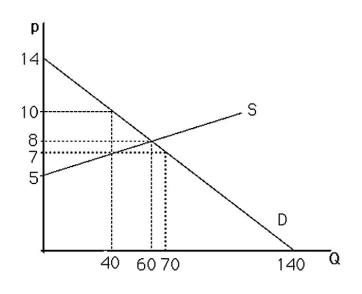
-The above figure shows a graph of the market for pizzas in a large town.Suppose that concern over dietary habits has led the government to impose a restriction that limits suppliers to produce only 40 pizzas.As a result,for prices greater than $7,the
A) supply curve is unchanged.
B) supply curve is vertical.
C) demand curve becomes vertical.
D) demand curve becomes horizontal.
Correct Answer:

Verified
Correct Answer:
Verified
Q24: If the supply curve of a product
Q25: An increase in the price of oil
Q26: <img src="https://d2lvgg3v3hfg70.cloudfront.net/TB6808/.jpg" alt=" -The above figure
Q27: What can explain the fact that DVD
Q28: <img src="https://d2lvgg3v3hfg70.cloudfront.net/TB6808/.jpg" alt=" -The above figure
Q30: If price is initially above the equilibrium
Q31: If a good is not produced,then there
Q32: What happens to the equilibrium price and
Q33: A leftward shift of the supply curve
Q34: Use a supply-and-demand graph to predict what