Multiple Choice

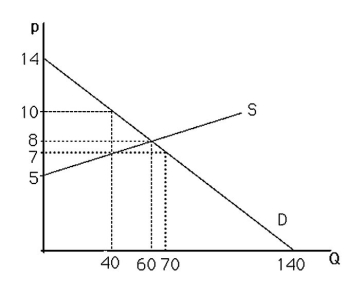
-The above figure shows a graph of a market for pizzas in a large town.At a price of $10,the market
A) is not in equilibrium.
B) has excess supply.
C) does not have excess demand.
D) All of the above.
Correct Answer:

Verified
Correct Answer:
Verified
Q96: Which of the following cultural events likely
Q97: During a mild winter,the price of home
Q98: <img src="https://d2lvgg3v3hfg70.cloudfront.net/TB6808/.jpg" alt=" -The above figure
Q99: Suppose the market demand curve for tacos
Q100: The price of crude oil increased to
Q102: When "rent controls" result in a shortage
Q103: <img src="https://d2lvgg3v3hfg70.cloudfront.net/TB6808/.jpg" alt=" -The above figure
Q104: A rightward shift of the supply curve
Q105: Suppose the market demand curve for pizza
Q106: Use supply-and-demand graphs to explain why parking