Multiple Choice
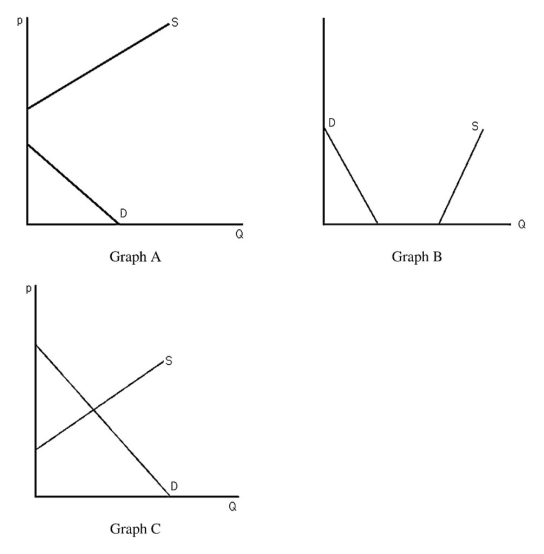
-The above figure shows three different supply-and-demand graphs.Which graph best represents the market for vacations on Mars?
A) Graph A
B) Graph B
C) Graph C
D) None of the above.
Correct Answer:

Verified
Correct Answer:
Verified
Q93: Usury laws place a ceiling on interest
Q94: If oranges were found to cure cancer,<br>A)
Q95: A market equilibrium occurs<br>A) only with government
Q96: Which of the following cultural events likely
Q97: During a mild winter,the price of home
Q99: Suppose the market demand curve for tacos
Q100: The price of crude oil increased to
Q101: <img src="https://d2lvgg3v3hfg70.cloudfront.net/TB6808/.jpg" alt=" -The above figure
Q102: When "rent controls" result in a shortage
Q103: <img src="https://d2lvgg3v3hfg70.cloudfront.net/TB6808/.jpg" alt=" -The above figure