Multiple Choice
In the following figure,the first panel shows a market situation prior to regulation and the second panel shows the effects of regulation. Figure 12.2 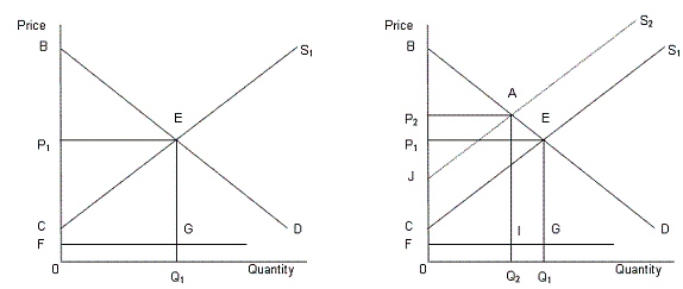 In the figure,
D: Demand curve for automobiles
S1: Supply curve of automobiles prior to regulation
S2: Supply curve of automobiles after regulation
FG: Clean up cost per unit
-What is the total societal surplus prior to regulation described in Figure 12.2?
A) Area 0FGQ1.
B) Area BEP1.
C) Area CEP1.
D) Area FGEP1.
E) Area BEC.
Correct Answer:

Verified
Correct Answer:
Verified
Q12: In the following figure, the first panel
Q59: <img src="https://d2lvgg3v3hfg70.cloudfront.net/TB1748/.jpg" alt=" -Which of the
Q60: The figure below shows revenue and cost
Q72: Which of the following was formed in
Q73: The three phases of antitrust policy in
Q74: When regulating a natural monopoly,government officials face
Q75: <img src="https://d2lvgg3v3hfg70.cloudfront.net/TB1748/.jpg" alt=" -One necessary step
Q77: Graphically,consumer surplus is the area:<br>A)above the demand
Q81: Which of the following is true ofthe
Q82: In the following figure, the first panel